대시보드 상단에는 4개의 KPI 카드가 표시되며, 그 아래에는 트렌드 차트가 이어집니다.
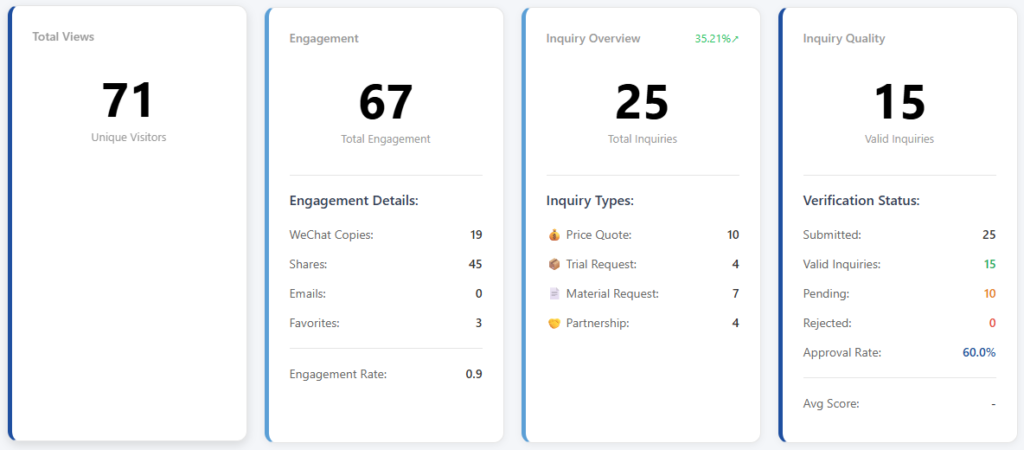
카드 1 — 트래픽: 귀하의 페이지를 본 사람 수입니다. 카드 2 — 참여도: 단순 조회를 넘어 귀하의 페이지와 상호작용한 사람 수입니다. 카드 3 — 문의 개요: 유형별로 문의 양식을 제출한 구매자 수입니다. 카드 4 — 문의 품질: 해당 문의 중 실제로 확인된 비즈니스 리드의 수입니다.
아래 트렌드 차트는 시간에 따른 일일 변화를 보여주며, 보기, 문의, 참여도의 세 가지 탭이 있습니다.
각 숫자가 정확히 무엇을 의미하며 어떻게 계산되는지 이해하려면 계속 읽어보십시오.
상세 지표 참조
카드 1 — 트래픽
조회수 — 귀하의 페이지를 연 고유 방문자 수입니다. 이는 개별 사용자가 페이지를 로드할 때마다 기록되는 원시 카운트입니다. 동일한 사람이 같은 기기에서 하루에 두 번 방문하면 한 번으로 집계됩니다.
카드 2 — 참여도
이 카드는 방문자가 귀하의 페이지에 도착한 후 수행하는 작업을 추적합니다. 네 가지 개별 액션과 두 가지 계산된 지표가 있습니다.
위챗 복사 — 원시 카운트입니다. 방문자가 귀하의 위챗 ID를 복사하는 버튼을 탭할 때마다 이 수치가 1씩 증가합니다. 이는 누군가가 위챗에서 귀하를 추가하려는 의도가 있음을 의미하지만, 실제로 실행하지 않을 수도 있습니다.
공유 — 원시 카운트입니다. 방문자가 위챗(모멘트, 개인 채팅 또는 그룹 채팅)을 통해 귀하의 페이지를 공유할 때마다 이 수치가 1씩 증가합니다.
이메일 문의 — 원시 카운트입니다. 방문자가 이메일 문의 버튼을 탭할 때마다 이 수치가 1씩 증가합니다. 중요: 이는 버튼 탭 횟수를 집계하며, 실제 이메일 전송 여부와는 무관합니다. 방문자가 탭 후 양식을 작성하지 않아도 여전히 집계됩니다. 실제 이메일 전송은 시스템에서 별도로 처리됩니다.
즐겨찾기 — 순 카운트입니다. 이는 저장 횟수에서 저장 취소 횟수를 뺀 값입니다. 방문자가 귀하의 페이지를 북마크하면 숫자가 증가합니다. 이후 북마크를 제거하면 다시 감소합니다. 따라서 이 숫자는 줄어들 수 있습니다.
총 참여도 — 계산된 값입니다. 이는 위의 네 가지 액션(위챗 복사 + 공유 + 이메일 문의 + 즐겨찾기)의 합계입니다.
참여율 — 계산된 값입니다. 총 참여도를 조회수로 나눈 값입니다. 100명이 방문하고 8건의 상호작용이 발생한 경우 참여율은 8%입니다. 이는 방문자 중 단순히 보는 것 이상의 행동을 하는 비율을 나타냅니다.
카드 3 — 문의 개요
이 카드는 양식 제출 횟수를 집계합니다. 각 숫자는 문의 양식의 원시 이벤트 카운트입니다.
견적 — 구매자가 가격 요청을 제출한 경우입니다. 시험 — 구매자가 샘플 또는 시험 요청을 제출한 경우입니다. 자료 — 구매자가 문서(카탈로그, 가격표, 인증서)를 요청한 경우입니다. 협력 — 구매자가 유통업체, 대리점 또는 OEM 협력 문의를 제출한 경우입니다.
총 문의 — 계산된 값입니다. 위의 네 가지 유형의 합계입니다.
문의율 — 계산된 값입니다. 총 문의를 조회수로 나눈 값입니다. 이는 전환율, 즉 실제로 문의를 제출한 방문자의 비율입니다. 200명이 방문하고 6명이 문의를 제출한 경우 비율은 3%입니다.
카드 4 — 문의 품질
모든 문의가 실제 비즈니스 리드는 아닙니다. 이 카드는 문의의 확인 상태를 추적합니다.
제출됨 제출됨 — 원시 총계입니다. 품질과 관계없이 들어온 모든 문의입니다.
유효 — 계산된 값입니다. 이는 단순한 카운트가 아닙니다. 수동으로 승인한 문의, 시스템이 자동 승인한 문의(판매자가 문의 이메일에서 확인 버튼을 클릭한 경우), 그리고 14일 이상 보류 상태로 조치 없이 남아 있던 문의(이의 제기가 없으므로 시스템이 기본적으로 유효로 간주)의 세 가지 출처를 합산한 값입니다.
보류 보류 — 원시 카운트입니다. 귀하의 검토를 기다리는 문의입니다. 제출되었으나 아직 분류되지 않은 상태입니다.
거부됨 거부됨 — 원시 카운트입니다. 귀하가 거부 사유(B2B 아님, 연락 불가, 스팸, 사기 또는 중복)와 함께 무효로 표시한 문의입니다.
승인율 — 계산된 값입니다. 유효 문의를 제출된 문의로 나눈 값으로, 백분율로 표시됩니다. 높은 승인율은 채널이 실제 구매자를 유치하고 있음을 의미합니다. 낮은 비율은 노이즈가 많음을 의미합니다.
평균 점수 — 계산된 값입니다. 모든 채널에 걸쳐 평균화된 품질 점수입니다. 이는 채널별 유효 문의 대 거부 문의 비율을 고려하여, 어떤 유통 채널이 더 높은 품질의 리드를 가져오는지 비교하는 데 도움을 줍니다.
트렌드 차트
KPI 카드 아래의 꺾은선형 차트는 ECharts를 사용하며 세 개의 탭이 있습니다:
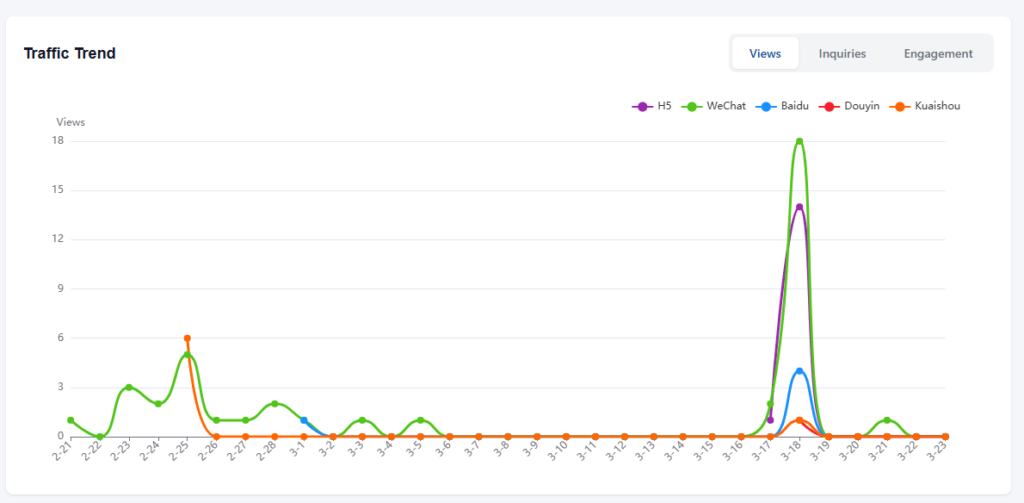
조회수 탭 — 시간 경과에 따른 일일 조회 수. 플랫폼 필터가 "전체"로 설정된 경우 각 라인은 서로 다른 플랫폼(WeChat, Baidu, Douyin 등)을 나타낼 수 있습니다."
문의 탭 — 시간 경과에 따른 일일 문의 제출 건수. 보기 설정에 따라 전체 또는 유형별로 표시됩니다.
참여 탭 — 시간 경과에 따른 일일 참여 활동 건수.
X축은 날짜, Y축은 건수입니다. 급증 현상은 일반적으로 특정 이벤트(전시회에서 배포된 QR 코드, KOL 게시물 게시, 유료 광고 캠페인 시작)와 연관됩니다. 급증 날짜를 QR 코드 배포 일정과 교차 참조하여 인과 관계를 파악하십시오.


