Your dashboard shows 4 KPI cards at the top, followed by a trend chart.
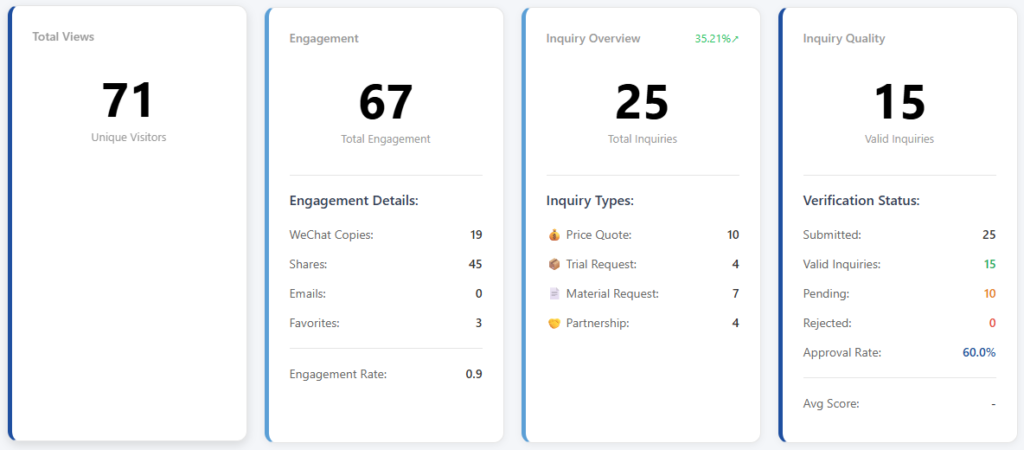
Card 1 — Traffic: how many people saw your page. Card 2 — Engagement: how many people interacted with your page beyond just viewing. Card 3 — Inquiry Overview: how many buyers submitted inquiry forms, by type. Card 4 — Inquiry Quality: how many of those inquiries are real, verified business leads.
The trend chart below shows daily changes over time, with three tabs: Views, Inquiries, and Engagement.
If you want to understand exactly what each number means and how it's calculated, read on.
Detailed metric reference
Card 1 — Traffic
Views — the number of unique visitors who opened your page. This is a raw count recorded each time a distinct user loads the page. If the same person visits twice in one day from the same device, it counts once.
Card 2 — Engagement
This card tracks what visitors do after they land on your page. There are four individual actions and two calculated metrics.
WeChat Copy — raw count. Each time a visitor taps the button to copy your WeChat ID, this goes up by one. It means someone intends to add you on WeChat, though they may or may not follow through.
Shares — raw count. Each time a visitor shares your page through WeChat (Moments, private chats, or group chats), this goes up by one.
Email Contact — raw count. Each time a visitor taps the email inquiry button, this goes up by one. Important: this counts button taps, not actual emails delivered. Even if the visitor doesn't complete the form after tapping, it still counts. The actual email delivery is handled separately by the system.
Favorites — net count. This is saves minus unsaves. If a visitor bookmarks your page, the number goes up. If they later remove the bookmark, it goes back down. So this number can decrease.
Total Engagement — calculated. This is the sum of all four actions above: WeChat copies + shares + email contacts + favorites.
Engagement Rate — calculated. Total engagement divided by views. If 100 people visited and 8 interactions happened, the engagement rate is 8%. This tells you what percentage of visitors are doing something beyond just looking.
Card 3 — Inquiry Overview
This card counts form submissions. Each number is a raw event count from the inquiry form.
Quote — a buyer submitted a pricing request. Trial — a buyer submitted a sample or trial request. Material — a buyer submitted a request for documents (catalogs, price lists, certifications). Partnership — a buyer submitted a distributor, agent, or OEM cooperation inquiry.
Inquiry Total — calculated. Sum of all four types above.
Inquiry Rate — calculated. Inquiry total divided by views. This is your conversion rate — the percentage of visitors who actually submitted an inquiry. If 200 people visited and 6 submitted inquiries, the rate is 3%.
Card 4 — Inquiry Quality
Not every inquiry is a real business lead. This card tracks the verification status of your inquiries.
Submitted — raw total. Every inquiry that came in, regardless of quality.
Valid — calculated. This is not a simple count. It includes three sources added together: inquiries you manually approved, inquiries auto-approved by the system (when the merchant clicks the verification button in the inquiry email), and inquiries that sat in Pending status for over 14 days without action (the system counts those as valid by default, since no one objected).
Pending — raw count. Inquiries waiting for your review. These have been submitted but not yet classified.
Rejected — raw count. Inquiries you marked as invalid, with a rejection reason (not B2B, unreachable, spam, fraud, or duplicate).
Approval Rate — calculated. Valid divided by submitted, shown as a percentage. A high approval rate means your channels are bringing in real buyers. A low rate means noise.
Average Score — calculated. A quality score averaged across all channels. This factors in the ratio of valid to rejected inquiries per channel, helping you compare which distribution channels bring higher-quality leads.
Trend chart
The line chart below the KPI cards uses ECharts and has three tabs:
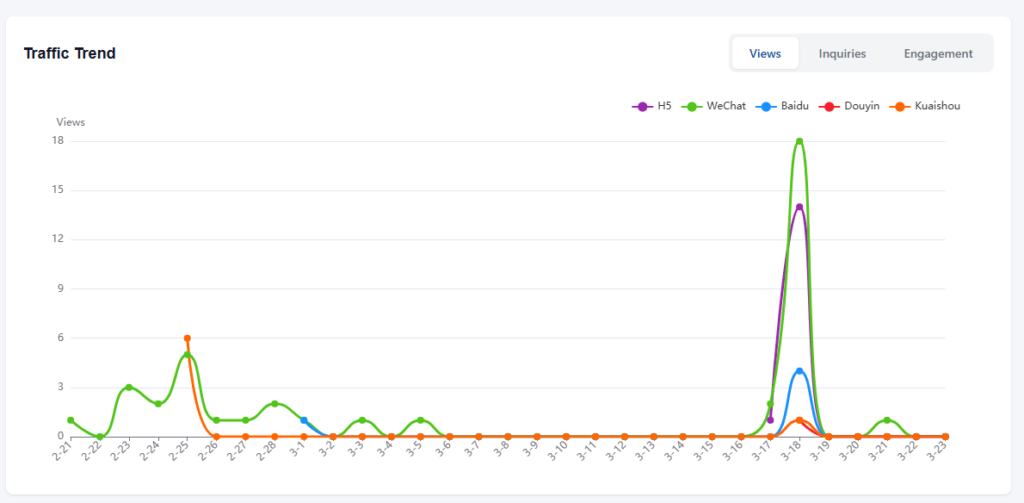
Views tab — daily view count over time. Each line can represent a different platform (WeChat, Baidu, Douyin, etc.) when the platform filter is set to "All."
Inquiries tab — daily inquiry submissions over time. Shows total or by type depending on the view.
Engagement tab — daily engagement actions over time.
The x-axis is the date. The y-axis is the count. Spikes usually correspond to specific events — a QR code distributed at a trade show, a KOL post going live, or a paid ad campaign launching. Cross-reference spike dates with your QR distribution timeline to understand cause and effect.


